


A user guide to GA4
Posted on 9th June 2023 at 14:26
Read Time: Approx. 4 Minutes 41 Seconds
Author: Lewis Stretton
With Universal Analytics (UA) almost coming to an end, we have made use of our multi screens and played plenty of games of spot the difference, to compare UA and GA4. So, what did we find?
What we found from using GA4?
Display:
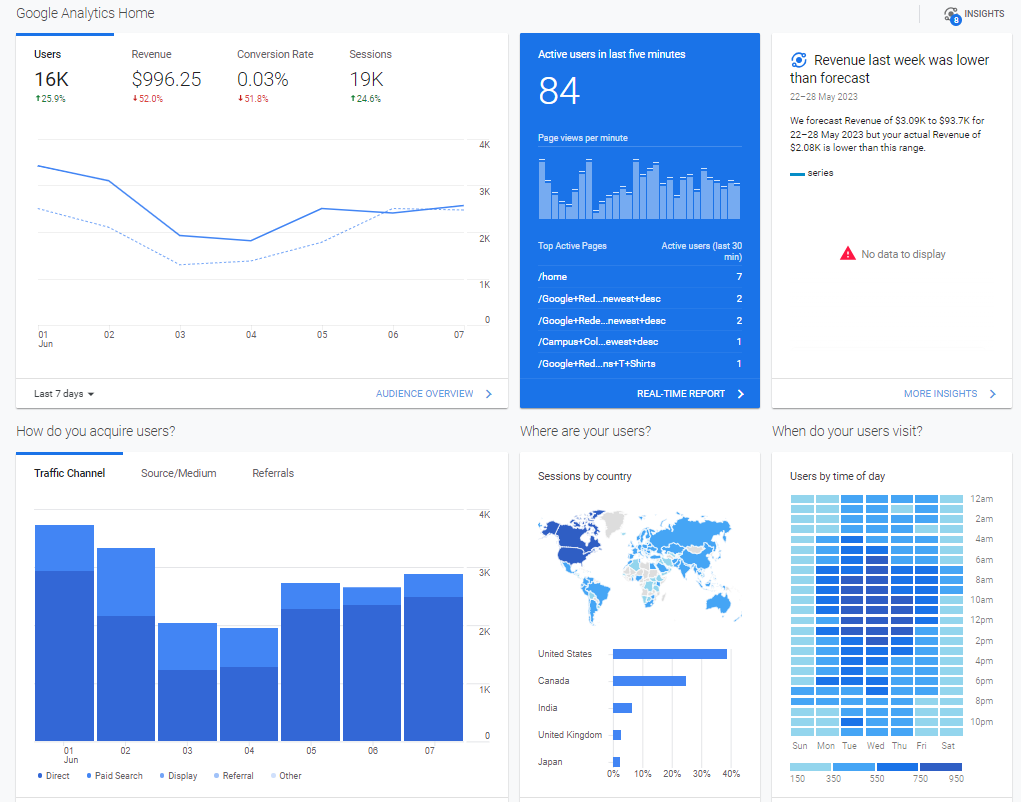
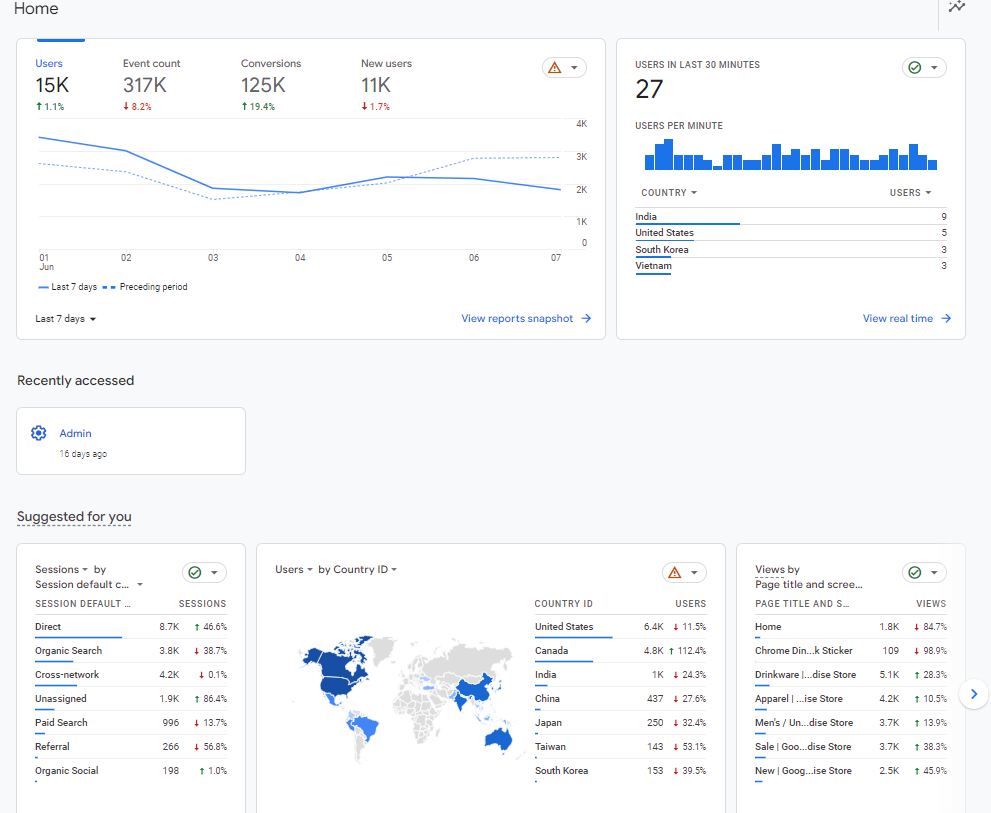
We have found the display of the platforms are different. Universal Analytics is a more compact platform, with data everywhere on its home screen. If we compare this to GA4, it is much nicer on the eye, with just as much information (if not more), but spaced out and easier to understand. You can change what information displays on this screen and ultimately it looks more aesthetically pleasing. Have a look for yourself ...
This isn’t just limited to the home screen; it’s on every page in GA4. We especially liked how reports looked. From a user point of view, it is easier to read and runs a lot smoother. We also found changing the metrics in your report simple and easier to navigate, especially using the search feature, to narrow down on the channel grouping you wanted to review and exploring some of the old and new secondary dimensions.
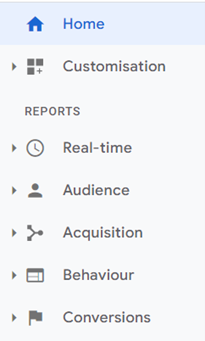
Reporting Categories:
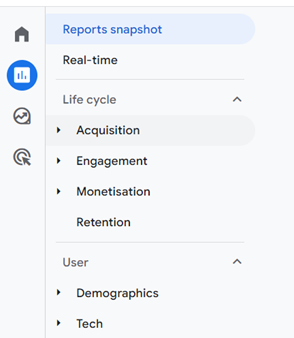
On UA, we know that you can do many different reports, all categorised within Audience, Acquisition, Behaviour and Conversion. Whilst using GA4, we spotted there is a difference with the naming of categories and where some of the existing reports are located. There are many new categories that UA didn’t have including Engagement, Monetisation and Retention. There are also user related reports like Demographic and Tech, separated out rather than being under the Audience category. For your page effectiveness reports that are typically in ‘Behaviour’, these are now found under ‘Engagement’, with many of the reporting views in ‘Conversion’ now in the ‘Advertising’ section of the navigation.
Types of Reports:
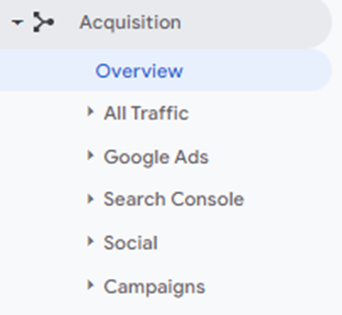
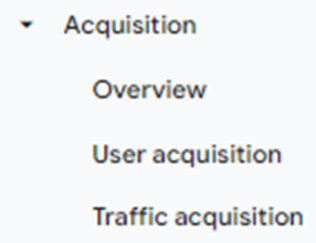
Keeping on the topic of reporting, we have seen many of our reports which we know and love disappear from GA4. But don’t worry, some have stayed. We also know that you can create new reports, so there is still hope to get them back. From our point of view, you are now unable to pull voucher code reports. UA has many report options under acquisition, whereas with GA4 there are only the Overview, User and Traffic Acquisition views available by default.
Metrics:
With Google changing their tracking model, some of the commonly used metrics have gone from GA4 including:
New Users
Average Session Duration
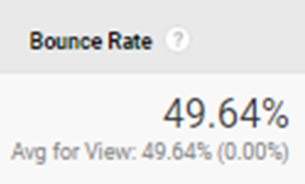
Bounce Rate
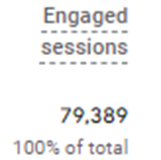
We also spotted a new metric called Engaged Session, along with other related metrics including Engaged Session Per User. According to Google, an Engaged session is a session that lasted 10 seconds or longer or had 1 or more conversion events or 2 or more page or screen views. This metric is now seen as the new proxy for the redundant bounce rate, so if you are still needing your bounce rate fix, just invert the metric! If you also want to change the timing of engaged sessions, you can head over to the settings area.
Data Discrepancies:
A big change is the discrepancies in data, which needs to be understood to educate internal stakeholders. Many metrics report different on each platform, some metrics are reporting higher, some are reporting lower. This is due to different models and how your data is being tracked. If you want to know more about the tracking model, read our Technical Guide to GA4.
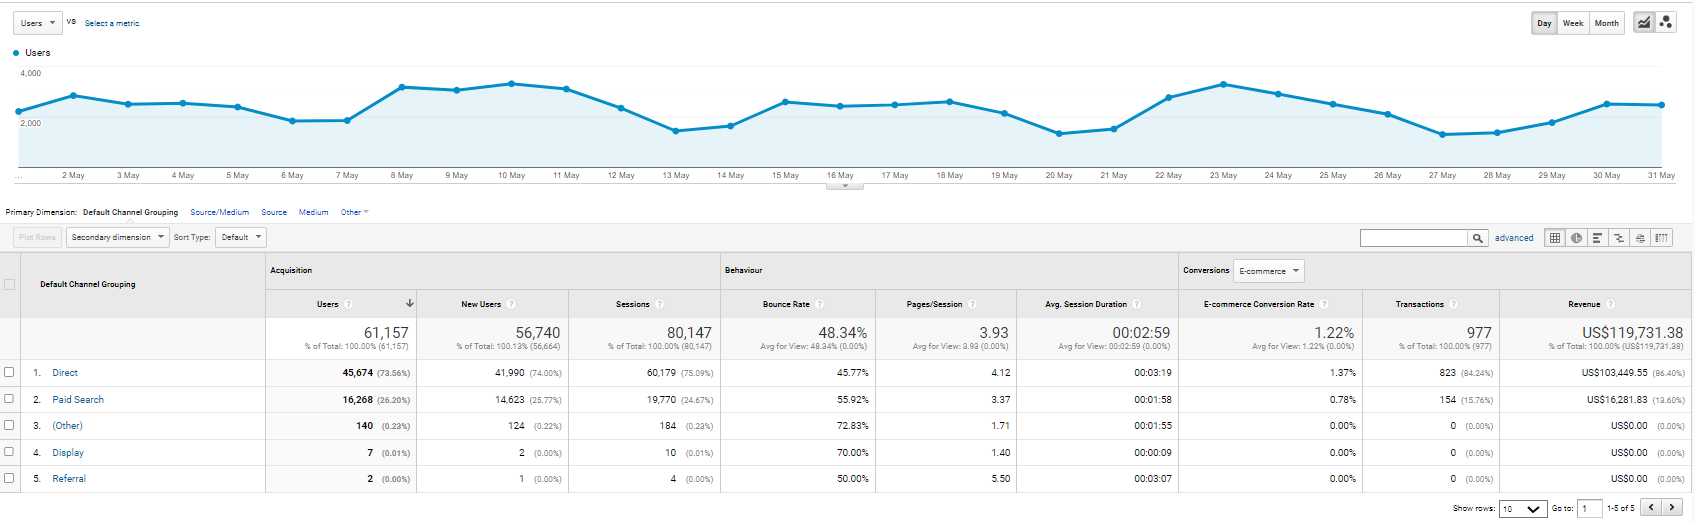
We see on the demo account supplied by Google Analytics, the total amount of revenue UA reported was $136,389.89, compared to $120,483.46 on GA4. The big change is sessions, we see in the demo account that the session difference is over a 15,000. To back this up, we have looked in to our partners accounts and have also seen that some metrics have reported variances of up to 10%.
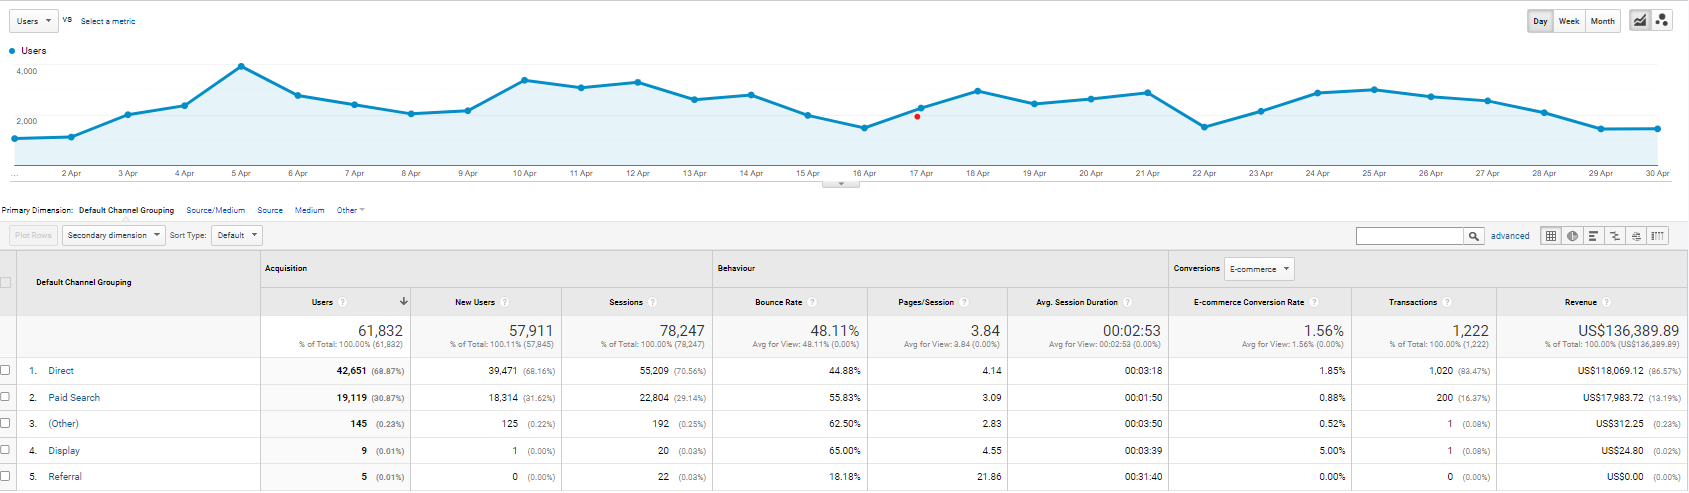
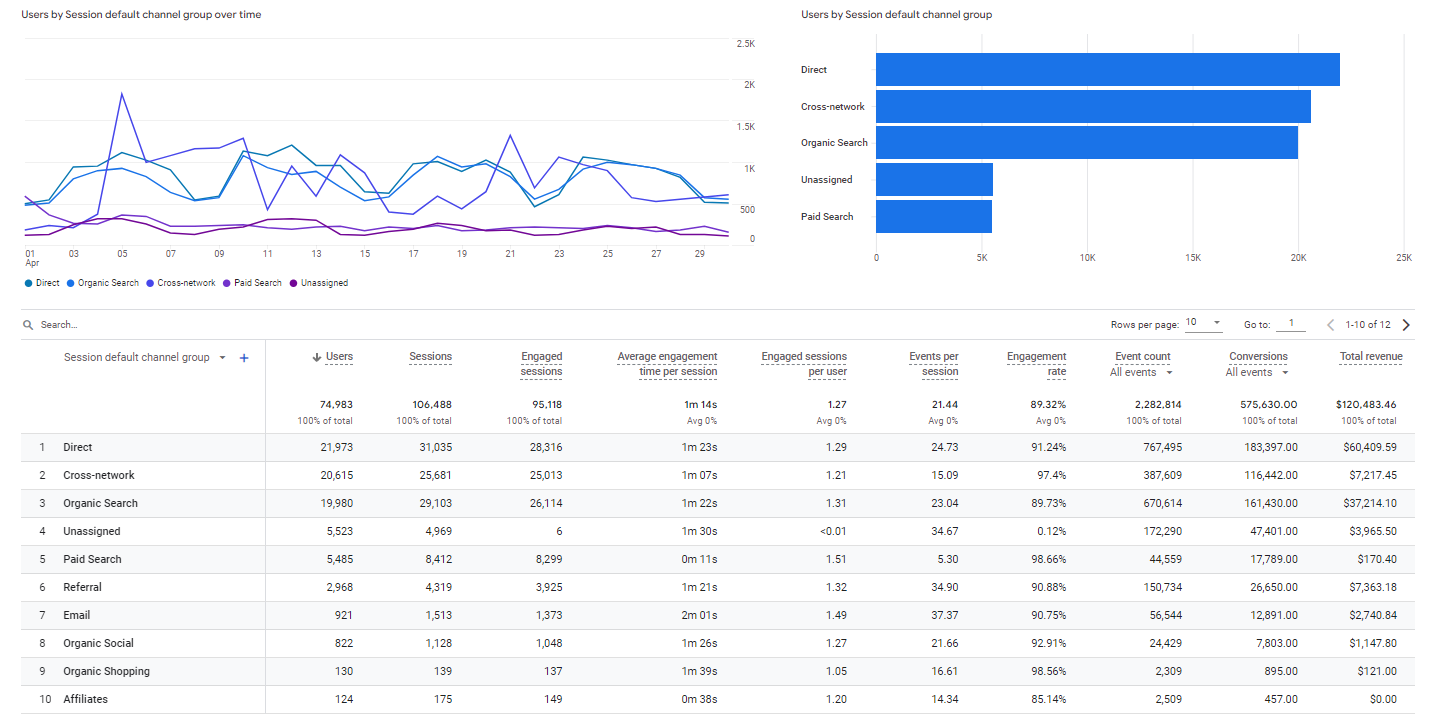
Default Channel Groupings:
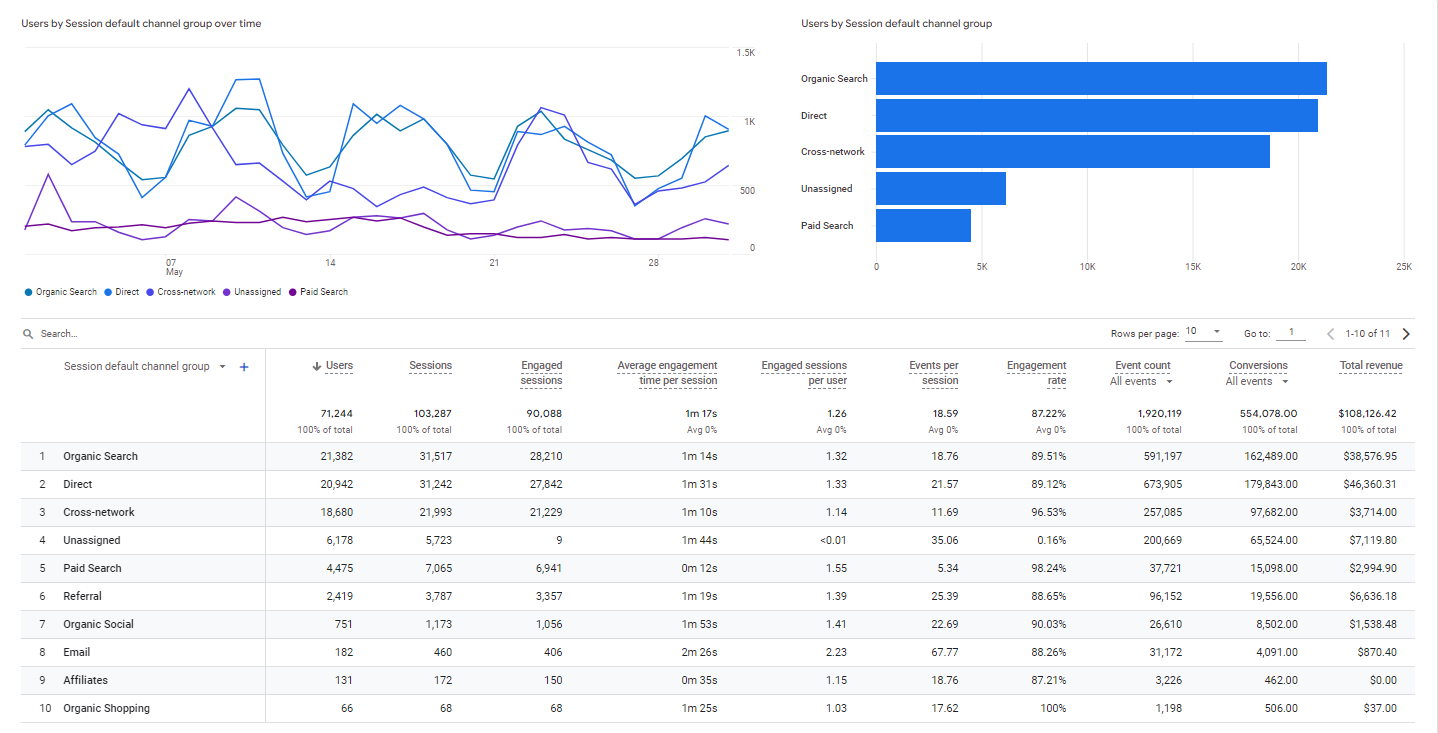
If you continue to look in to more detail on the Traffic Acquisition report, there are changes to the Default Channel Groupings. This includes Cross-network, for your Google Performance Max campaigns, along with Paid Shopping. To get an overall view of your paid search and shopping performance, you will need to aggregate Paid Search, Cross-network and Paid Shopping together. Another flag from the Traffic Acquisition report is that Direct conversions / revenue is inflated, based on the attribution model. We looked at one of our partners channels and the percentage of revenue for one was 38.21% on UA, compared to 23.63% in GA4 for the same time period.
To avoid such a discrepancy, we would recommend that everyone use the ‘Model Comparison’ view within the ‘Advertising’ section, to gain a more accurate comparison with your UA data. For our partners, we also use a combination of platforms, such as Shopify and Rakuten Advertising (for our affiliate marketing campaigns), to track changing trends across multiple platforms.
Also, beware that when you migrate, your bespoke channels that have been setup in GA to track non-standard campaigns, such as brand partnerships, OOH campaigns or inserts within product packaging, will not automatically be defined as a channel. So you may see an increase in ‘Unassigned’ data being tracked. We’d recommend identifying the source of this traffic and creating a custom channel grouping, to meet your business requirements.
Best Practices on GA4?
1. Ensure You’re Full Setup and Play Spot the Difference:
From personal experience as a user, we recommend if you haven’t already, to set up GA4 as soon as possible. Then, have a little game of spot the difference yourself, so you can check everything is set up correctly to avoid jumping headfirst into the deep end on the 1st of July. This really helped us understand and see the differences.
2. Take the GA4 Training and Exam:
If you are struggling to see and discover the differences Google GA4 has a great GA4 workshop full of knowledge, with an exam you can complete at the end. Our whole team completed this workshop and ultimately this helped us further understand the changes in GA4. The workshop is similar to the original Google Analytics exam, with GA4 references.
3. Create Your Own Reports and Metrics:
Now we know have discovered GA4 hasn’t got all the reports you use, you can create your own reports and metrics to use from July 1st. Doing this before the deadline, you can decide which reports you like and what metrics it uses, so you’re not struggling when you’re without Universal Analytics.
If you want to know the technical differences between UA and GA4 read our blog on GA4 is coming! Alternatively, if you would like any further information on the advice above on GA4, please feel free to contact us.
Share this post: